Widgets
Lenses offers a range of widgets that allow users to visualize and interact with blockchain data in a meaningful way. These widgets are designed to cater to different data analysis needs, from high-level metrics to customizable charts.
KPI Widgets
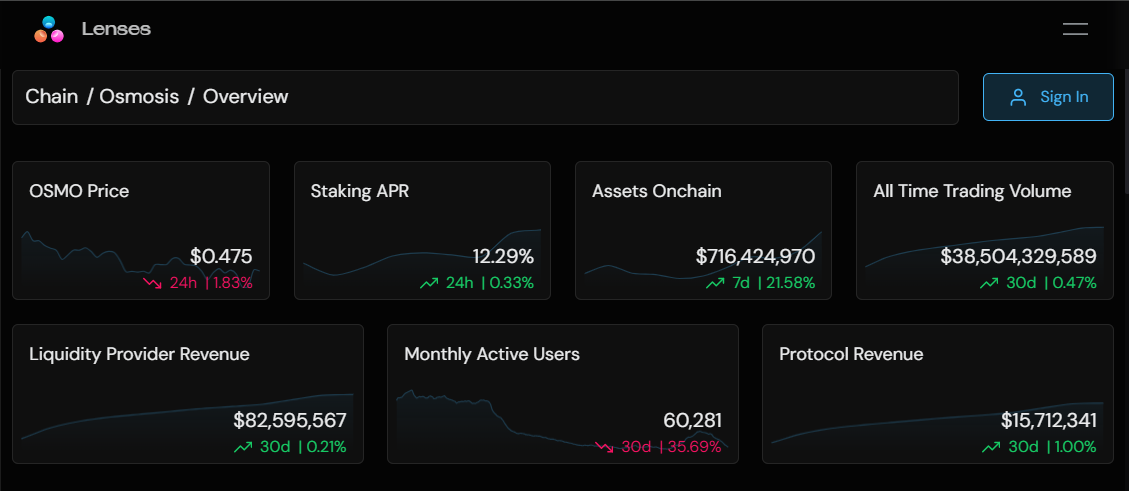
KPI (Key Performance Indicator) Widgets provide static, at-a-glance metrics that highlight the most important values related to blockchain activity. These widgets are particularly useful for:
- Displaying metrics like all time trading volume, monthly active users, and more.
- Providing immediate insights without requiring user interaction.

Interactive Widgets
Interactive Widgets allow users to explore data more dynamically, offering the ability to customize views and drill down into specific datasets. Filters and toggles can be used to refine timeframes, select specific data series, adjust accumulation settings, and more, providing you with a more tailored analysis.
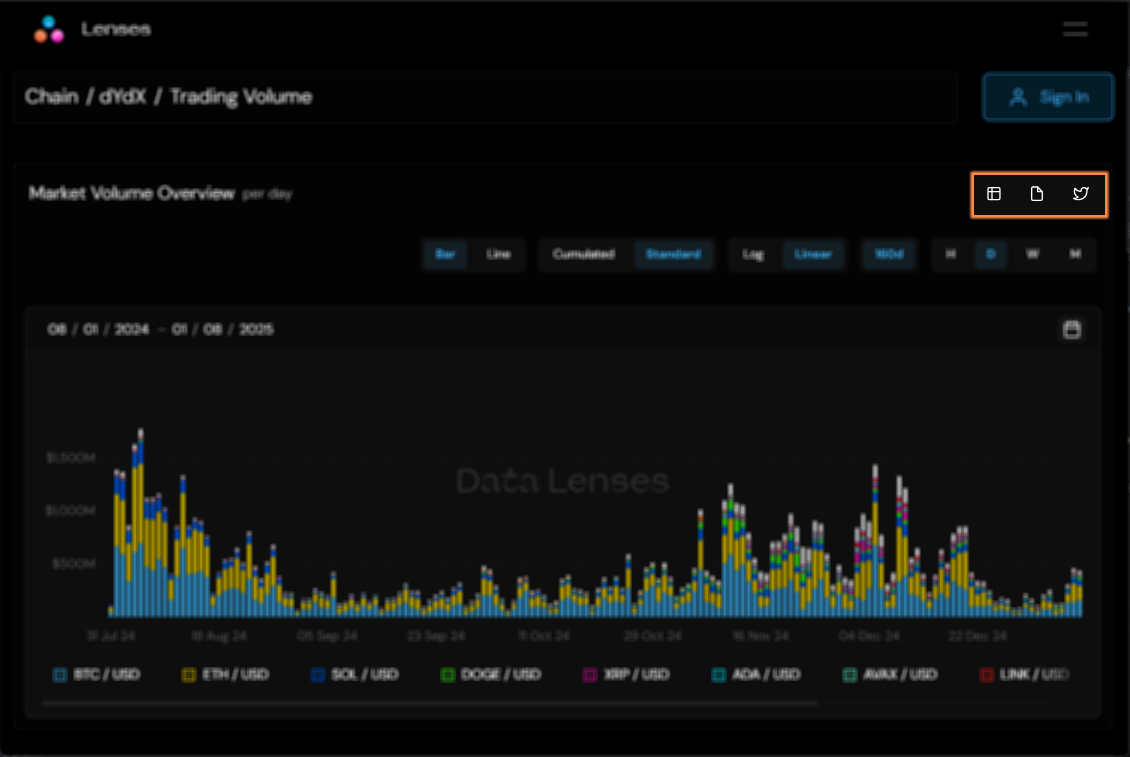
You can see the information either in Table or Chart format:
The widget can:
- Be shown either in Chart or Table format.
- Export data as CSV
- Tweet it!

Either chart or table presentation allow you to change the timeframe being shown, as exemplified below:
Chart
In the chart presentation format, you can toggle between the following options:
- Bar/Line: Choose between bar charts for comparing quantities across categories or line charts for visualizing trends over time.
- Cumulated/Standard: Toggle between cumulated data (aggregated values over time) and standard data (individual data points for specific intervals).
- Log/Linear: Switch between logarithmic scale (helpful for visualizing data with large value ranges) and linear scale (for evenly spaced data points).
- Timespan: Adjust the time interval displayed in the chart, selecting from hourly, daily, weekly, or monthly views to suit your analysis needs.
In the video example below, the Market Volume Overview widget is configured to show only BTC/USD, hourly, for the last 14 days as a bar chart.
Table
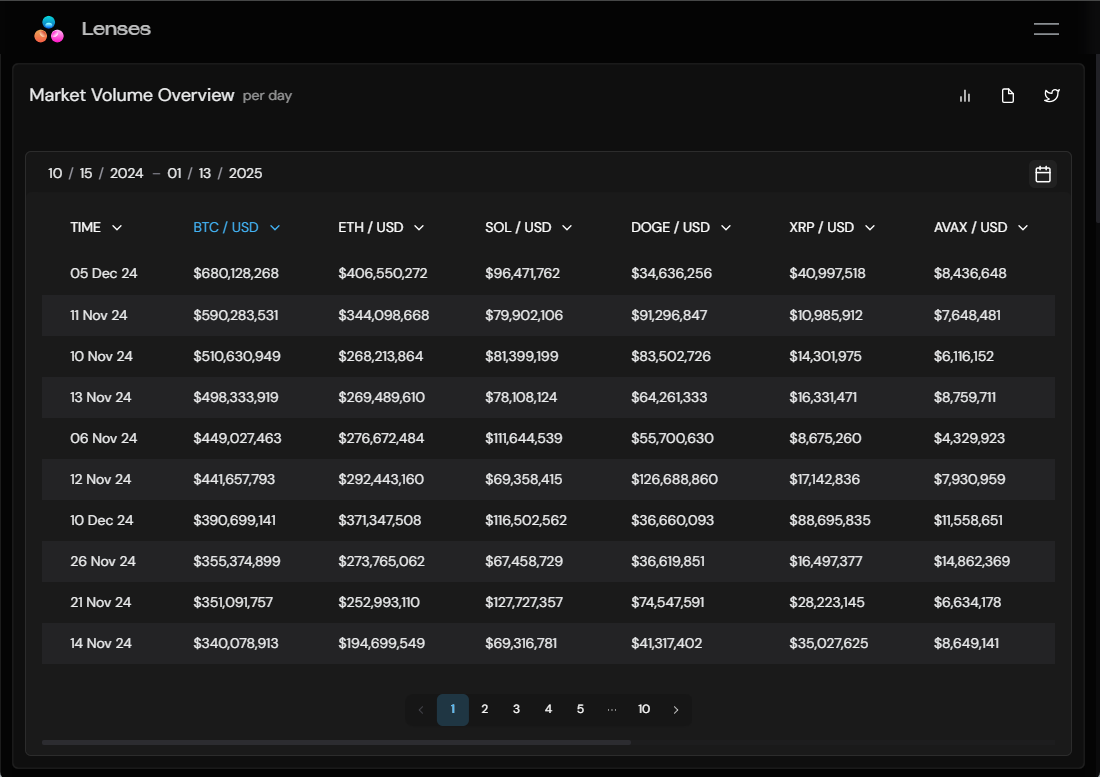
The table presentation format presents data in a paginated layout, making it easy to navigate through large datasets. Users can sort the table by any column to organize data according to their preferred criteria.
The image below orders the table with the BTC/USD column.
