Use Cases
Numia's SQL-based access through BigQuery enables developers and analysts to work with on-chain data for various applications. This page outlines practical examples of how to use Numia's datasets for building tools, analyzing data, and supporting business decisions.
Data export
If you're a developer needing on-chain data for your app, you can leverage Numia's datasets through BigQuery. Like any database, BigQuery allows you to export data via ETL jobs to your backend.
You can connect and query Numia's datasets using the BigQuery API or one of its client libraries.
Analytics
Numia's data provides extensive possibilities for analytics. The potential use cases for analytics are limited only by your creativity and SQL expertise, but these are some applications:
Validator Dashboards
Chain Analytics
Quarterly Reporting
Activity Monitoring
Examples
This section presents examples of NumiaSQL applications:
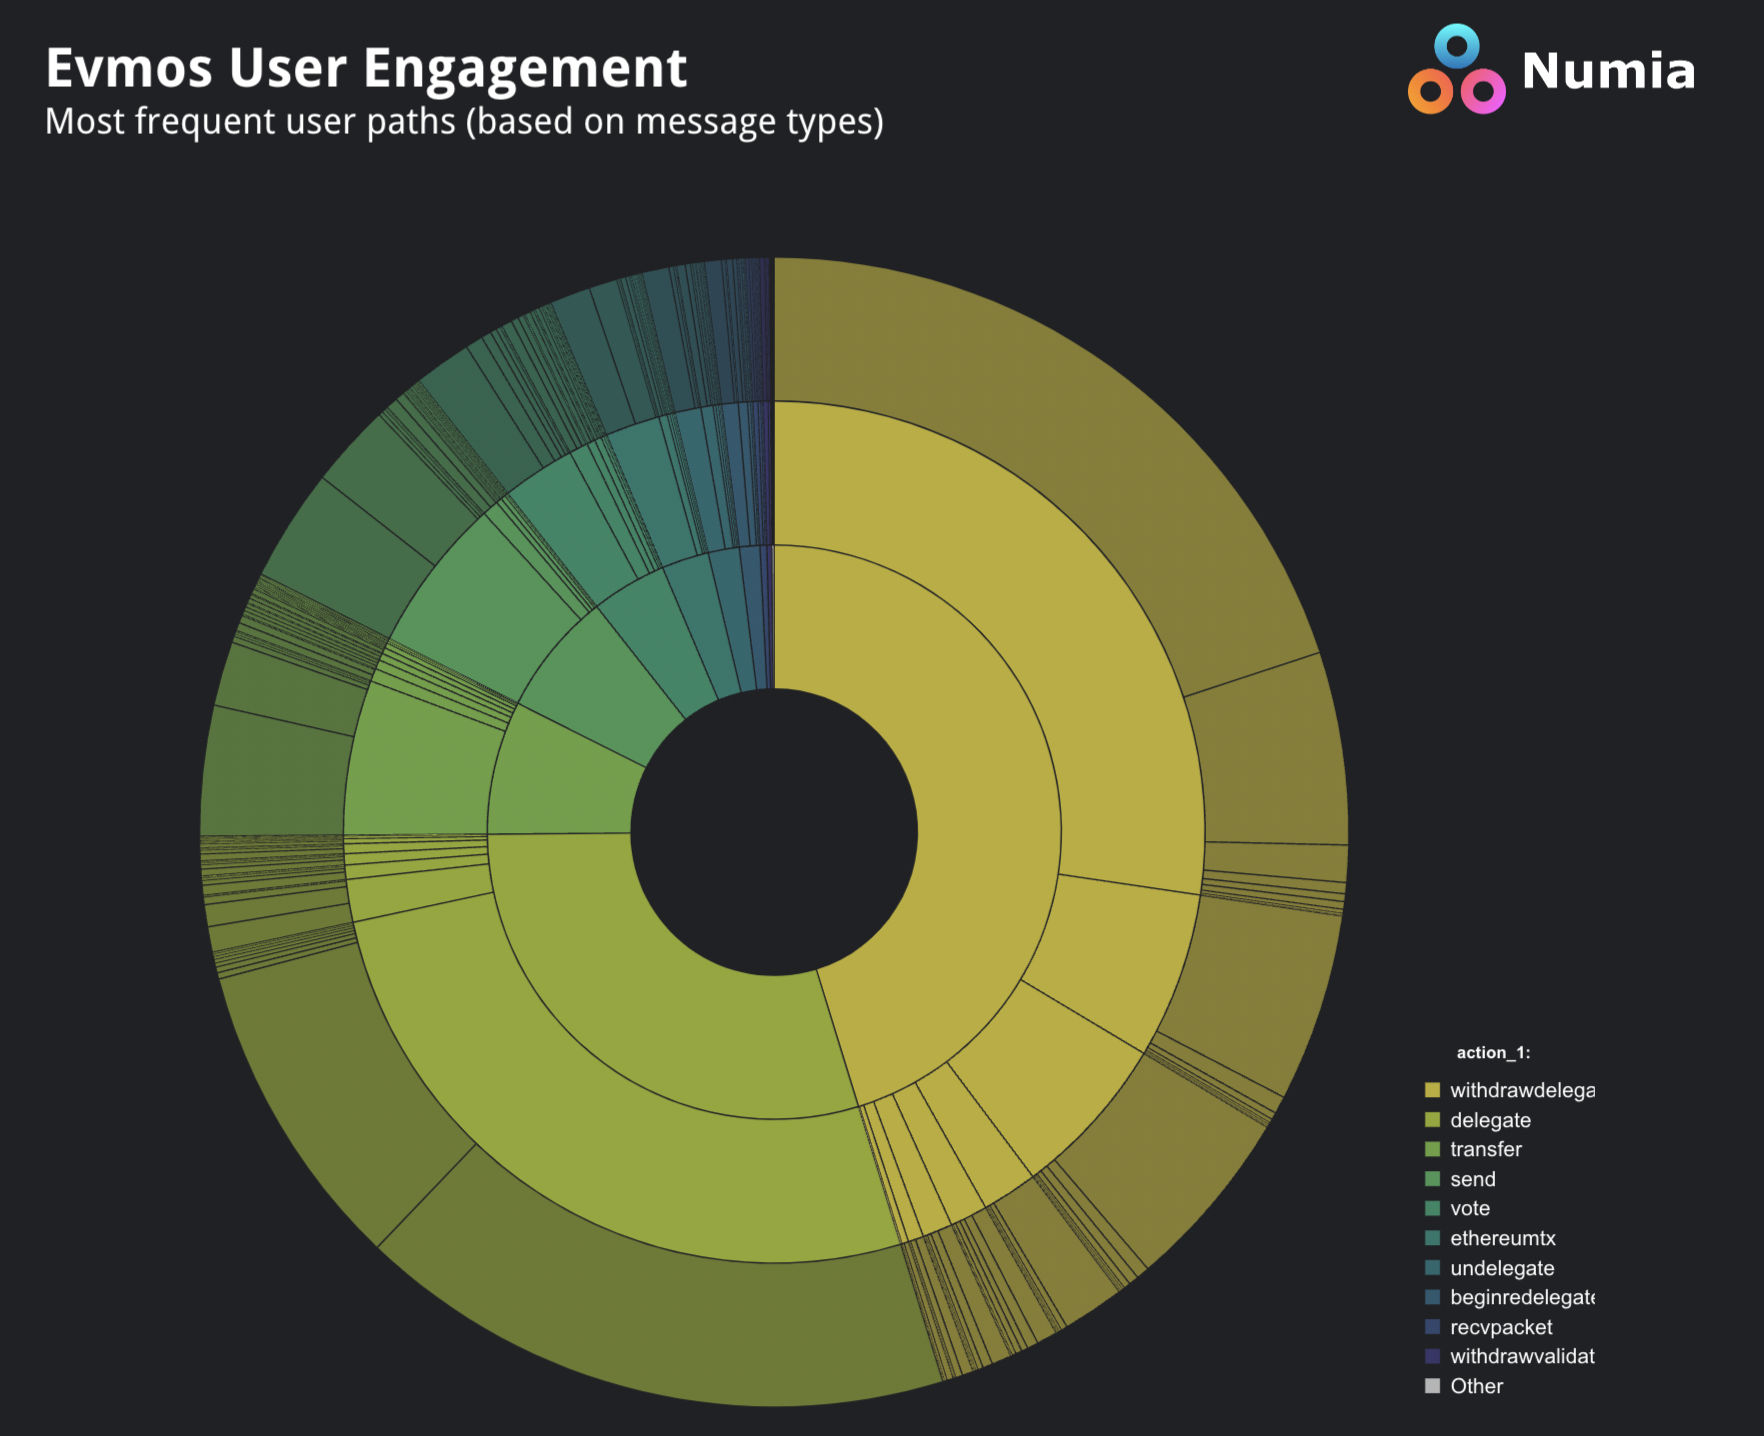
Build a Sunburst chart
Understanding common patterns in user behavior can provide valuable insights into how users interact with your platform. For example, what actions do users take after withdrawing rewards? What do they typically do after delegating?
To analyze these behaviors effectively, many UX and product experts rely on visual tools like the Sunburst chart. This chart helps uncover sequential patterns and pathways in user journeys, making it easier to identify trends and areas for improvement.

Below is a quick guide to help you create your own Sunburst chart and start exploring user behavior.
Video
Query
with transactions as (
select
  tx_id,
  msg_index,
  block_timestamp,
  message_type as action,
  sender as sender,
  rank() over(partition by sender order by block_timestamp asc, tx_id asc, msg_index asc) as sequence
from `numia-data.evmos.evmos_message_types_transactions`
where block_timestamp >= TIMESTAMP_SUB(CURRENT_TIMESTAMP(), INTERVAL 90 DAY)
and message_type not in ('exec','recvpacket','acknowledgement') -- exclude actions
order by sender asc, 6 asc, msg_index asc),

actions as (
select
  t1.tx_id,
  t1.sender,
  t1.action as action_1,
  t2.action as action_2,
  t3.action as action_3
from transactions t1
inner join transactions t2 on t1.sender = t2.sender and t2.sequence = t1.sequence + 1 and t1.action <> t2.action
inner join transactions t3 on t1.sender = t3.sender and t3.sequence = t1.sequence + 2 and t1.action <> t2.action
order by sender, t1.sequence asc)

select
  action_1,
  action_2,
  action_3,
  count(*) as frequency
from actions
group by 1,2,3
order by 4 desc
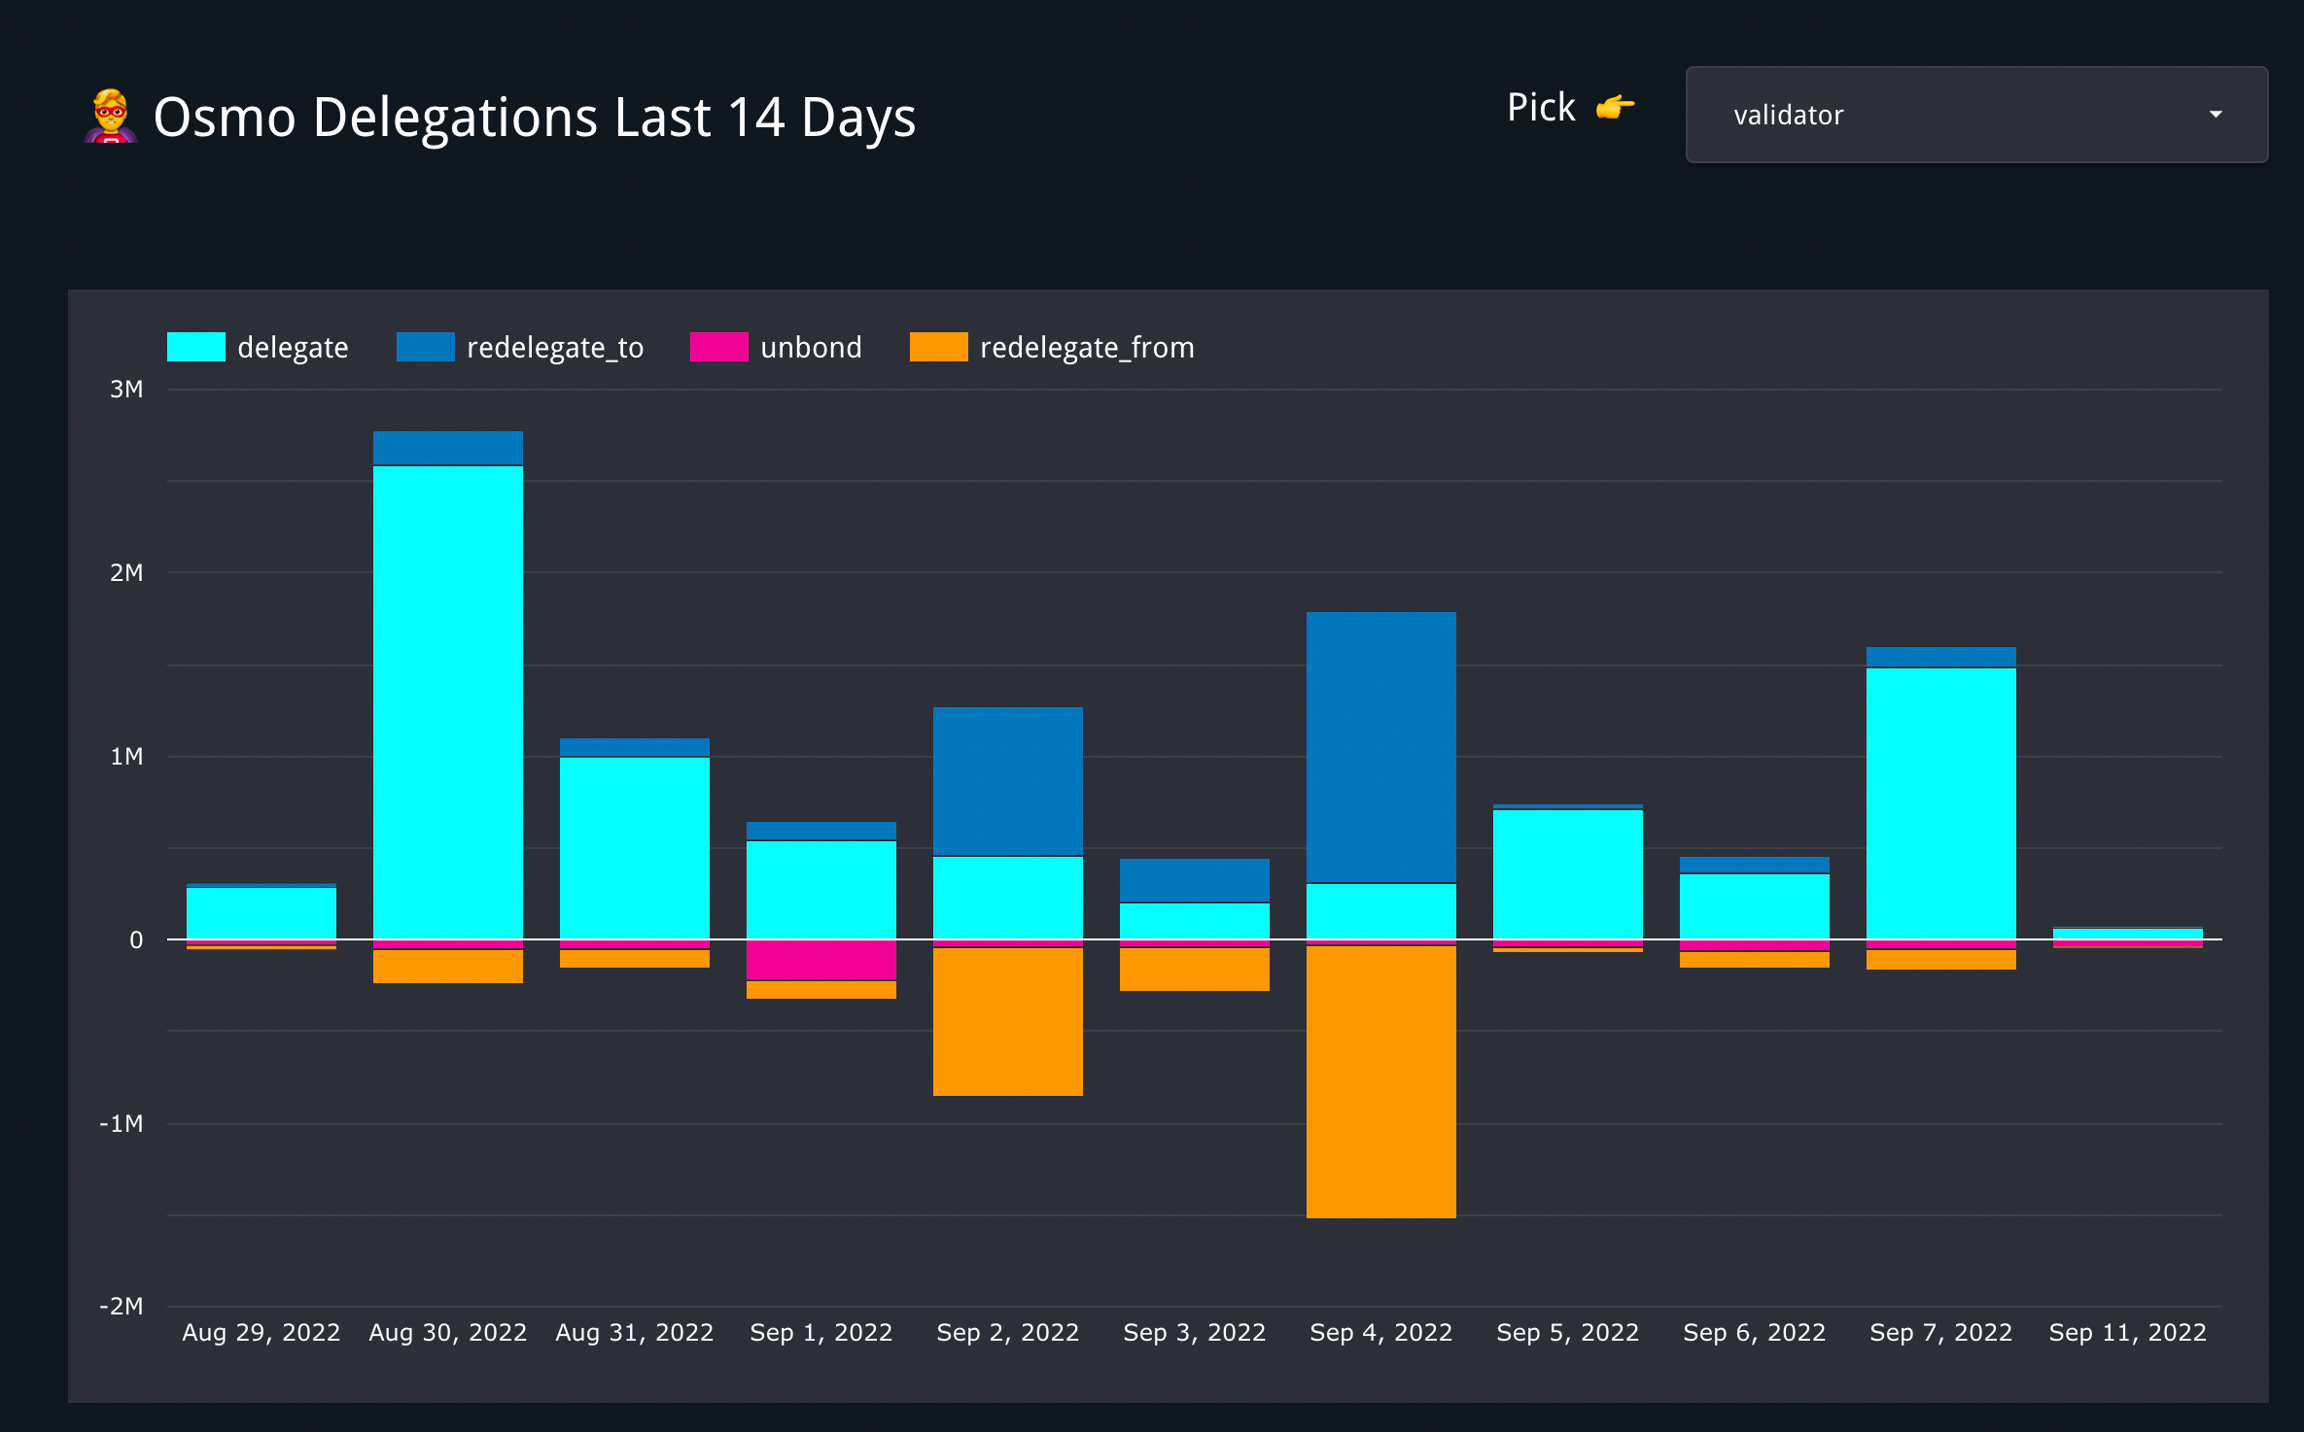
Osmosis staking and delegation activity
The Osmosis Staking and Delegation Activity Chart visualizes user interactions with staking and delegation features within the Osmosis ecosystem. It provides insights into how users engage with validators, re-delegate their tokens, and participate in staking activities, helping you better understand user behavior and trends.

View Osmosis Delegation Dashboard
Validator voting dashboard
The Validator Voting Dashboard offers a comprehensive view of voting patterns and decisions made by validators across governance proposals. It helps track validator engagement, proposal outcomes, and overall participation in the governance process, making it a useful tool for ecosystem monitoring and analysis.

View Osmosis Validator Dashboard
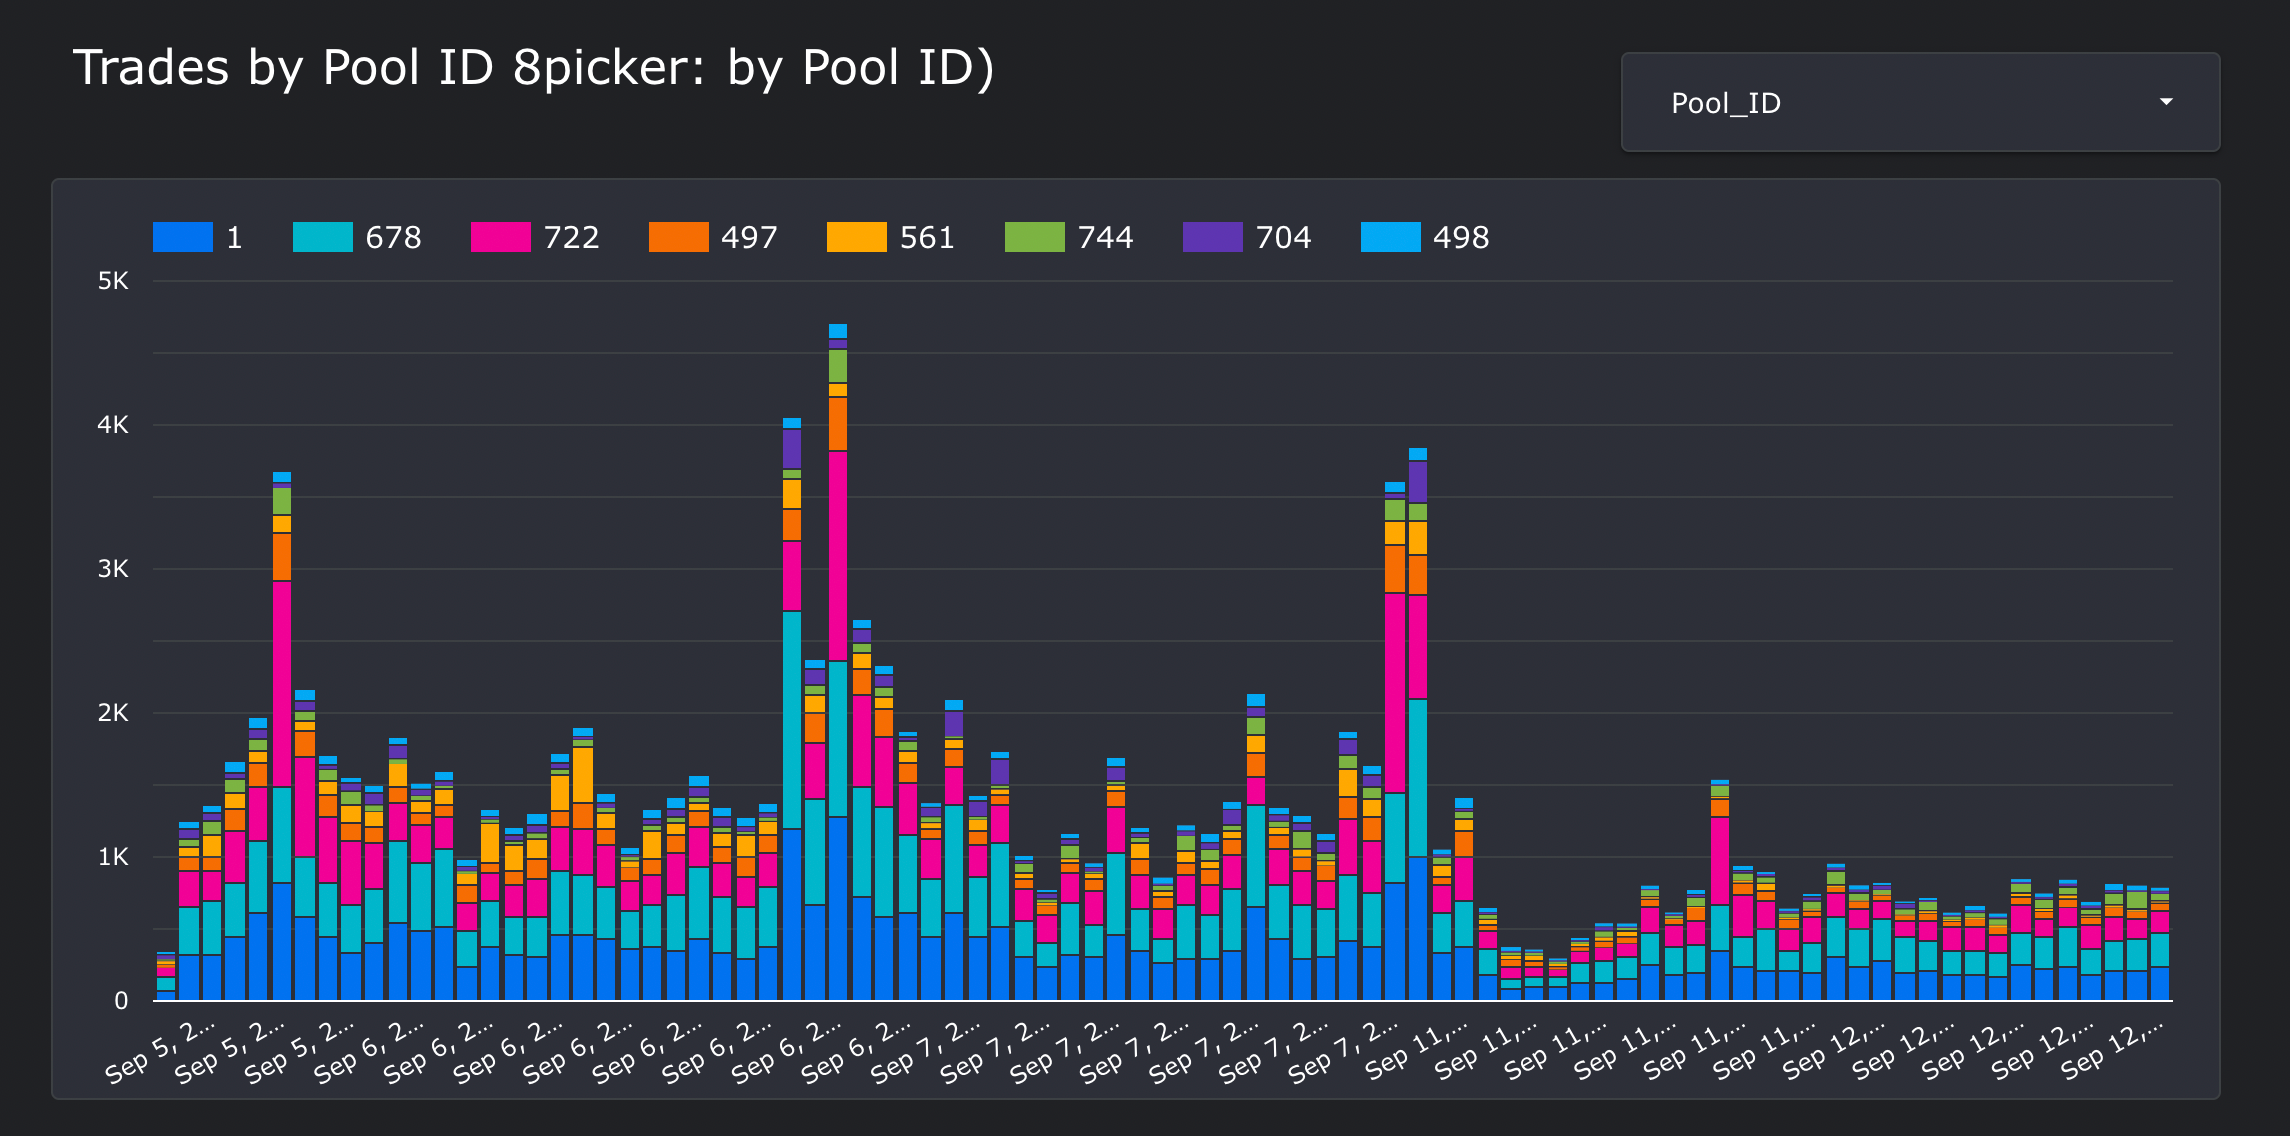
Chain and DEX activity
The Chain & DEX Activity dashboard highlights transaction trends, trading volumes, and user interactions across both the chain and decentralized exchanges. It provides a detailed look at the overall activity within the ecosystem, helping to identify key metrics and user behavior patterns in blockchain and trading operations.
